Strategy Tester Report
SMC MA Cross
AlpariUK-Demo (Build 225)
| Symbol | GBPUSD (Great Britain Pound vs US Dollar) | ||||
| Period | 1 Hour (H1) 2010.01.04 00:00 - 2010.02.26 22:00 (2010.01.01 - 2010.02.27) | ||||
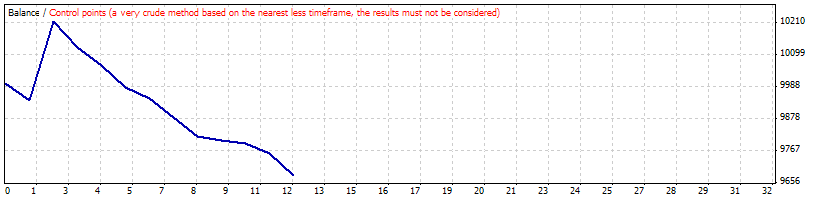
| Model | Control points (a very crude method, the results must not be considered) | ||||
| Parameters | Lots=0.1; LotsMultiplier=2; BreakEvenStart=25; ProtectProfit=5; TrailingStop=25; TakeProfit=100; RiskPercent=1; PositionManagement=false; OrderClosure=false; AllowedPositions=5; | ||||
| Bars in test | 1953 | Ticks modelled | 24825 | Modelling quality | n/a |
| Mismatched charts errors | 0 | ||||
| Initial deposit | 10000.00 | ||||
| Total net profit | -317.20 | Gross profit | 275.30 | Gross loss | -592.50 |
| Profit factor | 0.46 | Expected payoff | -26.43 | ||
| Absolute drawdown | 333.80 | Maximal drawdown | 612.50 (5.96%) | Relative drawdown | 5.96% (612.50) |
| Total trades | 12 | Short positions (won %) | 0 (0.00%) | Long positions (won %) | 12 (8.33%) |
| Profit trades (% of total) | 1 (8.33%) | Loss trades (% of total) | 11 (91.67%) | ||
| Largest | profit trade | 275.30 | loss trade | -89.20 | |
| Average | profit trade | 275.30 | loss trade | -53.86 | |
| Maximum | consecutive wins (profit in money) | 1 (275.30) | consecutive losses (loss in money) | 10 (-532.60) | |
| Maximal | consecutive profit (count of wins) | 275.30 (1) | consecutive loss (count of losses) | -532.60 (10) | |
| Average | consecutive wins | 1 | consecutive losses | 6 | |
| # | Time | Type | Order | Size | Price | S / L | T / P | Profit | Balance |
| 1 | 2010.01.07 02:00 | buy | 1 | 0.10 | 1.60334 | 0.00000 | 0.00000 | ||
| 2 | 2010.01.07 07:00 | close | 1 | 0.10 | 1.59735 | 0.00000 | 0.00000 | -59.90 | 9940.10 |
| 3 | 2010.01.08 10:00 | buy | 2 | 0.10 | 1.60167 | 0.00000 | 0.00000 | ||
| 4 | 2010.01.15 16:00 | close | 2 | 0.10 | 1.62920 | 0.00000 | 0.00000 | 275.30 | 10215.40 |
| 5 | 2010.01.22 10:00 | buy | 3 | 0.10 | 1.62654 | 0.00000 | 0.00000 | ||
| 6 | 2010.01.22 13:00 | close | 3 | 0.10 | 1.61762 | 0.00000 | 0.00000 | -89.20 | 10126.20 |
| 7 | 2010.01.25 16:00 | buy | 4 | 0.10 | 1.61845 | 0.00000 | 0.00000 | ||
| 8 | 2010.01.26 12:00 | close | 4 | 0.10 | 1.61196 | 0.00000 | 0.00000 | -64.90 | 10061.30 |
| 9 | 2010.01.27 12:00 | buy | 5 | 0.10 | 1.62093 | 0.00000 | 0.00000 | ||
| 10 | 2010.01.28 19:00 | close | 5 | 0.10 | 1.61350 | 0.00000 | 0.00000 | -74.30 | 9987.00 |
| 11 | 2010.02.02 19:00 | buy | 6 | 0.10 | 1.59745 | 0.00000 | 0.00000 | ||
| 12 | 2010.02.03 17:00 | close | 6 | 0.10 | 1.59348 | 0.00000 | 0.00000 | -39.70 | 9947.30 |
| 13 | 2010.02.09 18:00 | buy | 7 | 0.10 | 1.56781 | 0.00000 | 0.00000 | ||
| 14 | 2010.02.10 15:00 | close | 7 | 0.10 | 1.56131 | 0.00000 | 0.00000 | -65.00 | 9882.30 |
| 15 | 2010.02.11 19:00 | buy | 8 | 0.10 | 1.56800 | 0.00000 | 0.00000 | ||
| 16 | 2010.02.12 13:00 | close | 8 | 0.10 | 1.56141 | 0.00000 | 0.00000 | -65.90 | 9816.40 |
| 17 | 2010.02.15 11:00 | buy | 9 | 0.10 | 1.56740 | 0.00000 | 0.00000 | ||
| 18 | 2010.02.15 22:00 | close | 9 | 0.10 | 1.56598 | 0.00000 | 0.00000 | -14.20 | 9802.20 |
| 19 | 2010.02.16 03:00 | buy | 10 | 0.10 | 1.56834 | 0.00000 | 0.00000 | ||
| 20 | 2010.02.16 17:00 | close | 10 | 0.10 | 1.56752 | 0.00000 | 0.00000 | -8.20 | 9794.00 |
| 21 | 2010.02.16 18:00 | buy | 11 | 0.10 | 1.57331 | 0.00000 | 0.00000 | ||
| 22 | 2010.02.17 19:00 | close | 11 | 0.10 | 1.56965 | 0.00000 | 0.00000 | -36.60 | 9757.40 |
| 23 | 2010.02.22 16:00 | buy | 12 | 0.10 | 1.54871 | 0.00000 | 0.00000 | ||
| 24 | 2010.02.23 12:00 | close | 12 | 0.10 | 1.54125 | 0.00000 | 0.00000 | -74.60 | 9682.80 |